Introduction
As any other admin, you know that the VMs eventually start to suffer from disruptions, performance problems, or simply stop responding. That is a fact of life, unfortunately. Chances are, as a virtualization engineer, you’ve probably already met these problems at least once. And since the virtualized environment is quite a complicated system, there can be too many different reasons or factors that impact poor VM performance. Trying to find out what is wrong can take a lot of your time.
Today, we’ll try together to determine what can cause your VMware infrastructure to give away poor performance and find ways to avoid it.
So, what you’ll need for the proper troubleshooting?
First of all, records. Records are the Holy Grail in solving vSphere environment problems. I know, I know. Of course, you trust your memory 100%, and of course, you’ll remember all you need to know, like credentials to log in or any other necessary information. However, still, the last thing you want to happen when your server suddenly fails or your ESXi hosts being overloaded is nervously trying to remember passwords just to enter a host or vSphere vCenter.
Also, any existing documentation, such as vSphere cluster schemes, can be of great help. If you don’t really know how the whole system is configured, that’ll slow you down big time. Naturally, no person in the world actually loves to keep records, but believe, when the need arises, you’ll be thankful for having easily accessible information. Now, let’s take a look at what this info should consist of:
ESXi hosts:
- Host names / IP addresses
- ESXi host version and patch level
- Root password (keep it in secured location)
- Recorded IP addresses for storage and interface
- Host hardware description
- Storage configuration (iSCSI, etc)
- Network adapters (vendor, driver version, etc)
Storage Switches:
- IP addresses used
- Firmware version
- Credentials (keep it in secured location)
- Vlan settings
Storage Array:
- IP address of SAN management port
- Firmware level
- LUN configuration, RAID level, number of drives, sizes, drive firmware
- Logins and passwords to SAN array management interface
- Vendor specific SAN management tools (specific utilities)
As you can probably gather by now, the more documentation, the better. Sadly, a lot of admins tend to ignore this rule. Also, your documentation won’t be much of use if it’s outdated, so it needs to keep up with the changes as they go.
What to begin with?
1. Carefully study the best performance practices from VMware
This material remains critical and vital for two years now. In the beginning, there’s a troubleshooting scheme. The possible problems are sorted out according to their relevance (VMware Tools, CPU, etc) and their ranging (from 100% effect on performance to a minimal). If you use it, it can help you a lot to improve your infrastructure.
2. VMware Tools?
Make sure that VMware Tools are installed, upgraded, and running on every single one of your VMs. Basically, VMware Tools package is a suite of virtual device drivers that affect the performance of the virtual machine (usually for the better, of course).
Verify VMware Tools installation.
- Select a host in vSphere Web Client
- Move to Virtual Machines tab
- Add «VMware Tools Status» column
- Check the status. If it says OK, start looking for a next way to improve performance
- Not Running/Out of date – install VMware Tools
If VMware Tools aren’t starting, you’ll need to fix the guest OS, cause that’s where the problem might be. It’s either the Linux kernel updating or somebody for some reason has had VMware Tools in Windows disabled.
If your current VMware Tools version is out of date, you have to go for an upgrade using the vSphere Web Client context menu. Usually, that becomes a case after installing the latest updates on ESX/ESXi hosts. When you’re done with them, don’t forget to keep VMware Tools up to date as well. Overall, with vSphere Web Client, you can easily check up on your VMware Tools, as the following scheme suggests: 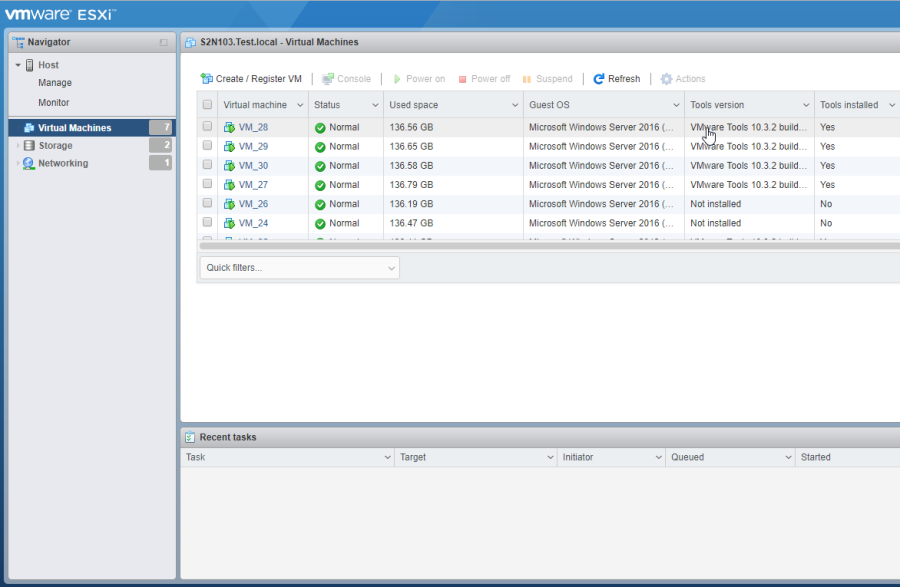
The vmtools status display for VMs.
You can add vmtools by clicking the right button of your mouse on the title and selecting it accordingly.
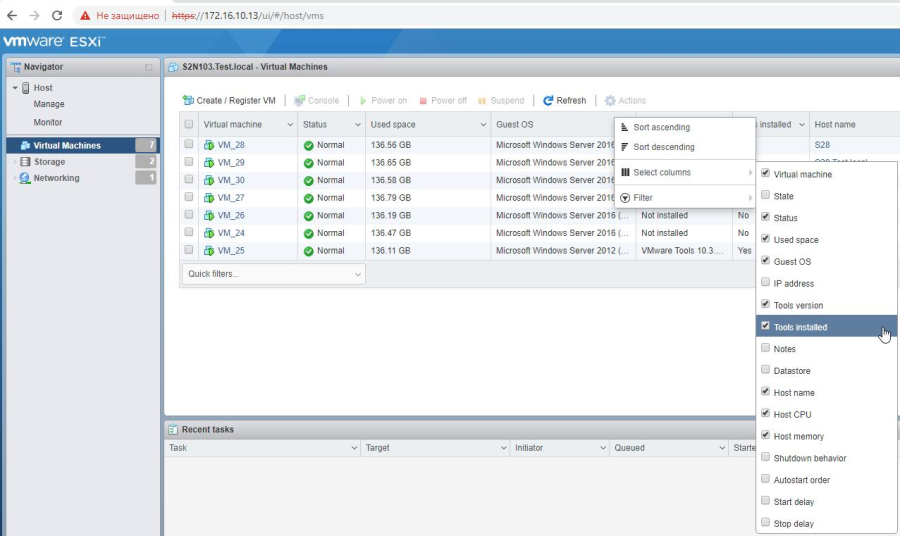 However, you can also apply the PowerCLI scenario, which checks upon the presence of the vmtools package and its current state. The bulk of the properties related to vmtools is found under <vm>.guest.extensiondata.
VMWare PowerCLI for ESXi and vSphere
PowerCLI for VMware vSphere is an incredibly powerful tool, based on Microsoft PowerShell/ PowerCLI enables you to execute 98% of manual tasks for managing virtual infrastructure from the command line. As a tool, PowerCLI allows centralizing ESXi and vCenter Server operational management in the command line. Thanks to this wonderful utility, you are able to create scenarios, monitor the state of VMs, storage, networks, user accounts, and, the cherry on the cake, automate a bulk of operating processes. You can install PowerCLI on machines with Microsoft Windows 7 / Windows Server 2008 R2 and higher, but what’s more interesting, there are several versions for different Linux kits.
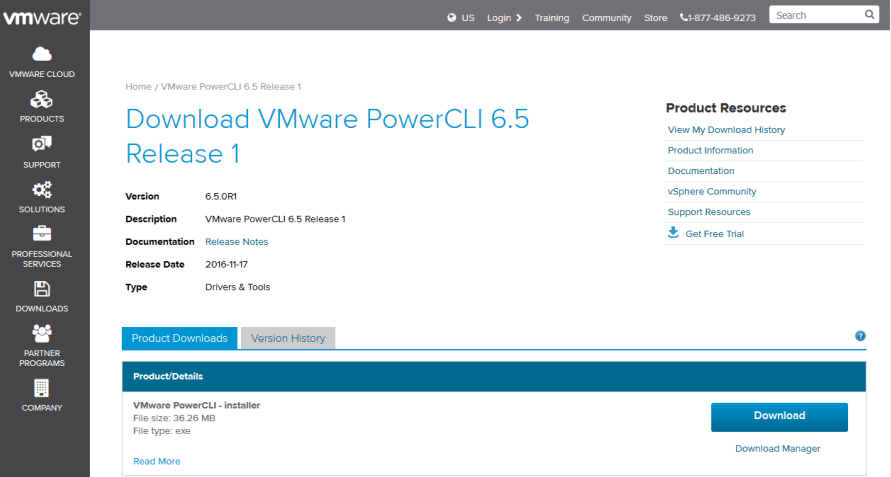
PowerCLI consists of more than 1900 cmdlets for the management of cloud and virtual VMware infrastructure (vSphere, vSAN, vRealize Operations Manager, vCloud Director, Site Recovery Manager, Horizon 7, and vCloud Air). When executing cmdlet, you address the API on selected ESXi host or vCenter Server. Good news: you can download the latest patch of VMware PowerCLI from the VMware official site (yep, of course, you’ll need an account for that).
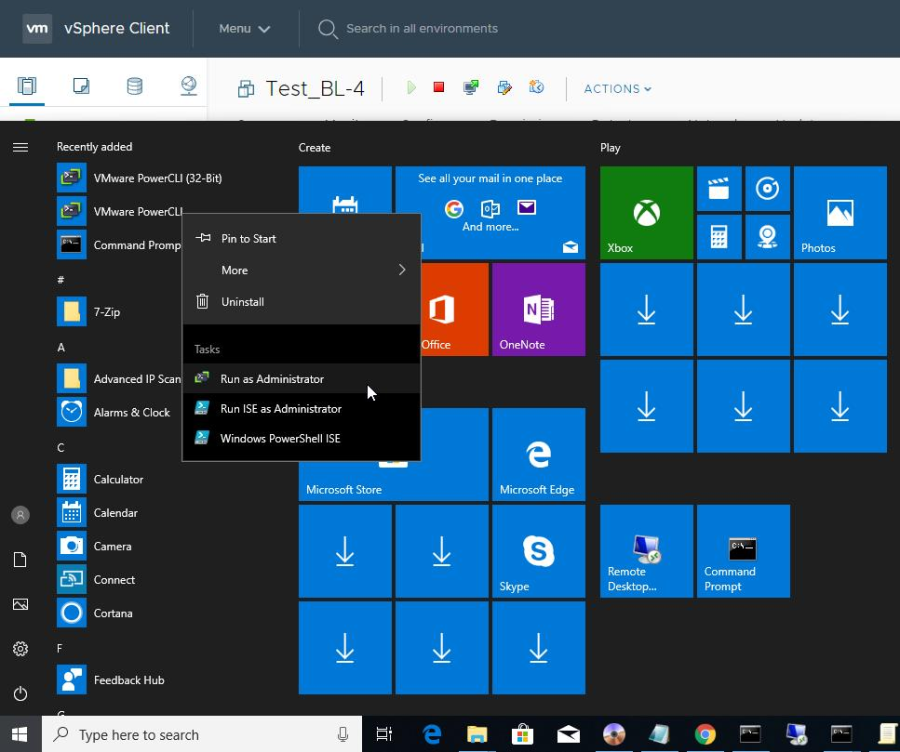
To get on with the PowerCLI console, just start VMWare VSphere PowerCLI shortcut as an admin.
Basic Problems
1. Lack of resources for the VM
I know, I know, admittedly, having enough resources for the VM to perform efficiently is a must-have. However, you’d be shocked as to how many VMs are not assigned sufficient resources according to the guest OS requirements and the applications running under it. I mean, you ought to know it like the back of your hand that despite countless benefits virtualization brings to the table, there are always overheads to contend with. Like, what’ll VM do if it runs out of RAM? Naturally, your machine will start swapping to disk much more frequently. If the underlying storage is full, performance will suffer a huge blow. That’s why, whenever you have a chance to do so, use reservations, resource pools, DRS, and anything you can to make sure the correct amount of resources are assigned to a VM for maximum operational efficiency.
2. Performance Monitoring
Basically, performance monitoring is a function embedded in vSphere clients. This one right here is one of those necessary tools that’ll help you examine performance-related issues. It is so good because it enables you to use alarms wherever possible, so you’re always one step ahead of any performance issue. 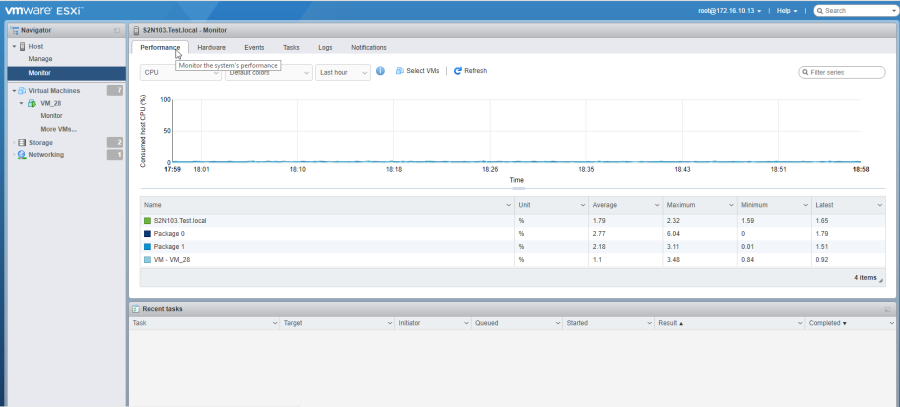
Keep in mind, however, that while working on the local ESXi host, you can reach only the Performance tab. If you want more details, use VMware® vSphere vCenter. 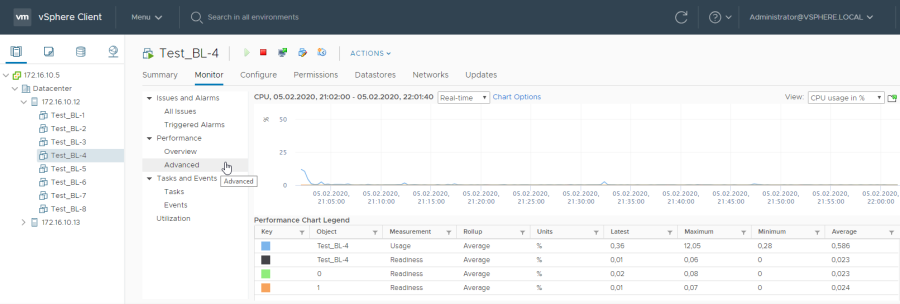 SUPER IMPORTANT. Performance and Advanced Performance are more than effective and informative diagnostic tools. If you use it right, you’ll have no trouble finding the soft spot of your system.
Let’s take Resource Pool CPU Saturation as an example. To look up details:
- Choose resource pool and move to Performance. Then, switch it up to Advanced and select CPU object;
- Evaluate current saturation in MHz (Usage);
- Compare the value of resource pool limitation and the current saturation. If it is close to the limit, there’s a possibility that you lack resources and all that you need to do is reevaluate CPU ready value of the separate VMs in this very pool;
CPU Ready verification:
- For CPU Ready. select a VM, move to Performance, then choose Advanced mode, and switch to reviewing «CPU» (if you’re up to troubleshooting performance of the specific VM, start with that one);
- Evaluate Ready for all VM “objects”. “Object” is a separate virtual processor of the VM. You’ll need to change the properties of the «Chart Options…» to picture it;
- Tell me, does minimal or average Ready value for any virtual processor exceed 2000ms? If so, when, it’s all clear now. You simply lack processor resources because of the limit set to your resource pool;
- Now just do the same for the rest of the VMs in this pool.
Host CPU Saturation verification:
- Select the host, move to Performance, then switch to the Advanced mode, and choose a “CPU” object;
- Evaluate current saturation in MHz (Usage);
- Does it exceeds 75%, or the top is 90%? If so, then, perhaps, you lack host processor resources. Verify CPU Ready for the VM on this host as I did below. If an average saturation of the central processor does not exceed 75%, the next is for you to look at!
CPU Ready Verification:
- If you’re up to troubleshooting the performance of the specific VM, start with that one. Otherwise, select a host, move to Virtual Machines, sort out the list as in Host CPU — MHz (column to column), and take a look at one or two VMs from the beginning of the list;
- To measure up CPU Ready, select a VM, move to Performance, switch to Advanced mode and then switch to reviewing «CPU» (if you’re up to troubleshooting the performance of the specific VM, start with that one);
- Evaluate Ready for all VM “objects”. “Object” is a separate virtual processor of the VM. You’ll need to change the properties of the «Chart Options…» to picture it;
- Does minimal or average Ready value for any virtual processor exceed 2000ms? If so, you lack host processor resources.
Potentially problematic parameters that need verification:
- Guest CPU Saturation Verification;
- Active VM Memory Swapping Verification;
- VM Swap Wait Verification;
- VM Memory Compression Verification;
- Overloaded Storage Device Verification;
- Dropped Receive Packets Verification;
- Dropped Transmit Packets Verification;
- One vCPU in an SMP VM Verification;
- VM CPU Ready in the host with average load Verification;
- Slow or overloaded Storage System Verification;
- Top Storage System Load Verification;
- Peak network Data transmission Verification;
- Low VM processor Saturation Verification;
- Past VM Memory Swapping Verification;
- High Resource Pool memory demand Verification;
- High Host memory demand Verification;
- High Guest Memory Demand Verification;
- High Timer-Interrupt Rates Verification;
- NUMA settings Verification;
- High VM snapshots response time Verification;
Disk Subsystem Problems
In short, you can narrow storage system problems down to:
1. A storage system is overloaded;
- What are the reasons why a storage system can get overloaded? Well, the primary ones are quite simple, whether it would be wrong configurations (amount and type of devices/RAID level/caching/etc) or very high load.
There’s no universal solution, so I’m going just to put on my Captain Obvious uniform and list down things you probably already know: - Build your storage system with the regard to performance, not only capacity;
Take into account that when you go virtual, the load type can switch too (from consistent to random);
DO have in store utilities to monitor storage system disk performance, you need to watch it together with esxtop; - (Esxtop – the VMware console tool, works well to monitor storage performance. Log in to the ssh session and start. For those of you who tend to use resxtop: you’ll have to download vMA or vSphere CLI for Linux, and start this tool from there. But to be fair, the last version is universal for it works with both ESX and ESXi;
- Also, there is a brilliant vSCSIStats utility;
If you are wondering why storage system is working so slow, you can figure it out with the FIO synthetic load;
Keep in mind that certain applications can lower their disk overheads if you provide them with more memory.
2. Slow storage system;
Basically, do everything from the list above!
3. Storage system delays;
3 simple solutions:
Shares;
Limit IOPS;
Congestion Threshold (Storage IO Control).
4. Bad disks;
Check your disk/ network storage on a regular basis, and if something were to fail or go out of date, replace it immediately. However, you ought to know that, in some cases, especially when the disk has failed, starting checking (additional use of RAID memory) can bring other disks to the same fate = doom the whole RAID.
5. ESXi OS;
Use separate disks for the ESXi host OS, the swap partition, and VMs residing on a local datastores. Also, think about using RAID to improve read and write performance.
6. Snapshots;
Delete any unused or redundant snapshots, that’s not optional. You must know by now that the more snapshots you have, the greater the disk overheads will be with the I/O activity.
7. Encryption;
Use disk encryption only when necessary! Encryption leads to overheads, overheads lead to decreased performance, and we don’t want that, do we now?
(If you are interested in more information, you are welcome to look it up yourself)
Small Tips
Deploying vRealize Operations Manager for a more profound assessment of your environment
This vRealize Operations Manager is a VMware product designated for complex monitoring and managing VMware vSphere virtual infrastructure. Vendor has promised an integrated working troubleshooting. You can download it here.
Ask yourself a question: Is VM really behaving oddly?
A VM that subjected to a heavy workload can sometimes look like it’s giving away poor performance. For example, virtualized instances of SQL servers or poorly written SQL queries can slow down your performance big time! The mail servers with large user bases can be a bit of a problem in this regard as well. Luckily, the performance monitoring charts in vSphere Web client will help you measure resource utilization within a specified period so that you can confirm if the troubling behavior was a one-time thing or ongoing and to determine whether it is expected or not under such circumstances. MS SQL and Exchange Server are taking up any RAM from the VM’s guest OS they can find, especially if dynamic memory allocation is configured.
http://buildvirtual.net/analyze-io-workloads-to-determine-storage-performance-requirements/
Latest updates and latest versions
Updates and latest releases more often than not address performance problems with fixed bugs, improved drivers, and code. Nevertheless, trust me on this one; sometimes, the latest release makes it even worse! So stay alarmed and test until you’re sure. Or at least let others try and work on it, so you can make a decision that was thought through.
Antivirus software ESXi
You have a bigger chance of bumping into a unicorn, but there are cases, in fact, when you can find antivirus software running on ESXi (vShield). No need to explain further that such a thing can severely affect VM performance in multiple ways if it is not configured correctly. You also have to remember that there is no reason to run antivirus software on ESXi due to its small footprint and inbuilt security features. I would suggest that it would be much better if anti-malware software to be relegated to the VM’s guest OS. If you must install AV on ESXi, do make it a point to exclude VM files such as VMDKs from scanning schedules, especially during peak utilization hours.
Is CPU power management enabled?
CPU power management, if it’s enabled on ESXi servers, can lead to the speed latency, which, in turn, can be picked up by applications or workloads resulting in slower performance. If you think this is the root of the problem, you have to check it up with the vendor documentation on disabling CPU power management. In case that has zero effect, re-enable it and do a health check a couple of times (more details here)
Power battery for Bios and SCSI controllers
Check a power battery for Bios subsystem of your ESXi host, if the specifications allow it, also for SCSI or the other controllers. SCSI cache often requires additional power for work, and the power battery on the controller board usually provides it. Even though the specifications claim it to be a backup power plan, I have found out that the power battery undervoltage leads to mistakes in the work of controllers, and I managed to fix it only by replacement.
Few pieces of advice in the end:
- Do a health check of all physical architecture for your storage system, including iSCSI switches, networking and optical cables, etc.
- Check the switches logs to make sure there are no errors or another unfortunate events happening to the storage system or the device itself.
- Ping your iSCSI from your vmkernel addresses, just to make sure that connecting to iSCSI is no problem.
- Do a health check for SAN itself – be sure that there are no failed disks, storage controller failover events, or any other mistakes that can affect the performance.
- Check free disk space on every LUN connected to your ESXi hosts.
Conclusions
I know, VMware vSphere ESXi troubleshooting can look a little bit scary. However, with precise documentation, a good understanding of your infrastructure, and a few efficient built-in tools, you can fix any problems troubling your VMs. Just stop for a moment and think where exactly and what problem do you have, and then figure out what part of the system is causing trouble. I hope that utilities, command-line ESXTOP, esxcli, and, last but not the least vRealize Operations Manager would be able to help you if the need ever arises. Also, don’t be hesitant to ask VMware or vendor technical support for help. Very often, they can help you fix it amazingly fast.


