
Introduction
As you remember from my previous article, I have been interested in testing the performance levels of two virtual SAN configurations from different vendors. I got my results, but this experience prompted me to continue. Here, I’ve chosen to try another configuration for performance comparison, albeit with only a slightly different list of participants.
Since no one needs an introduction from VMware vSAN, I’d like to say a few words about its companion – Ceph. Basically, it is an object-based software storage platform. I know that doesn’t sound epic at all, but Ceph is also completely fault-tolerant, uses off-the-shelf hardware, and is extremely scalable. The most interesting thing is that some Ceph releases apply erasure-coded data pools so that it would be a less resource-hungry solution than traditional replicated pools. In practice, that means the following: when you store an object in a Ceph storage cluster, the algorithm divides this object into data and coding chunks, stored in different OSDs (that way, the system could lose an OSD without actually losing the data).
Now, that’s when I thought that theoretically, Ceph could make a good virtualization platform (proper configuration, of course), so I had to see whether it would be justified in terms of time and resources spent. Naturally, I hardly could have done it without a credible comparison, hence VMware vSAN (with a similar configuration, of course, otherwise it would make no sense).
So, shall we?

Time to Look Under the Hood!
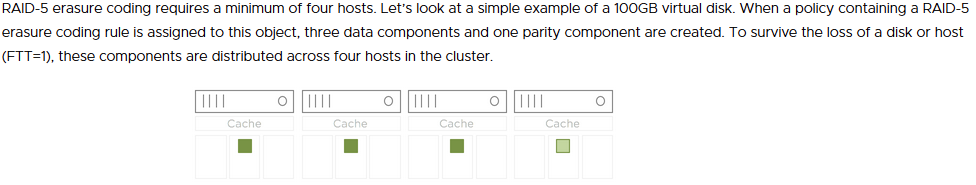
So, today’s participants are VMware vSAN’s 4-node configuration (RAID5 – erasure coding) and Ceph (Erasure coding 3+1). Keep in mind, though, that my goal is rather to establish if Ceph is up to the task than to determine which configuration gives more performance.
Now it seems to be the time to take a look at the test environment:
Hardware:
| node-{01..04} | Supermicro X10DRH |
|---|---|
| CPU2x Intel(R) Xeon(R) CPU E5-2630 v4 @ 2.20GHz | |
| Sockets | 2 |
| Cores/Threads | 20/40 |
| RAM | 64Gb |
| NIC | Mellanox ConnectX-5 MCX456A-ECAT (100 GbE\s) |
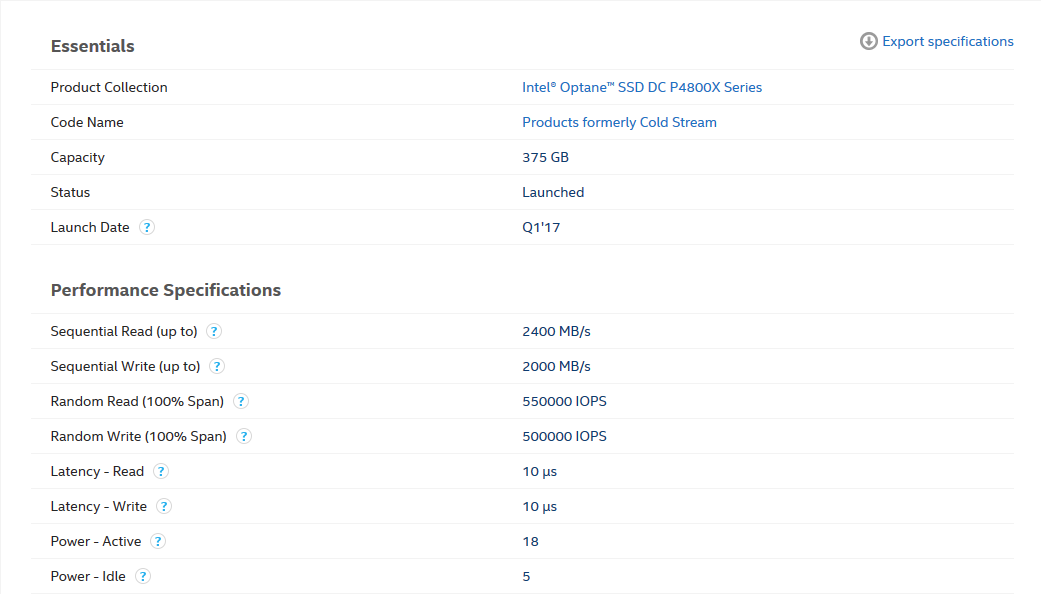
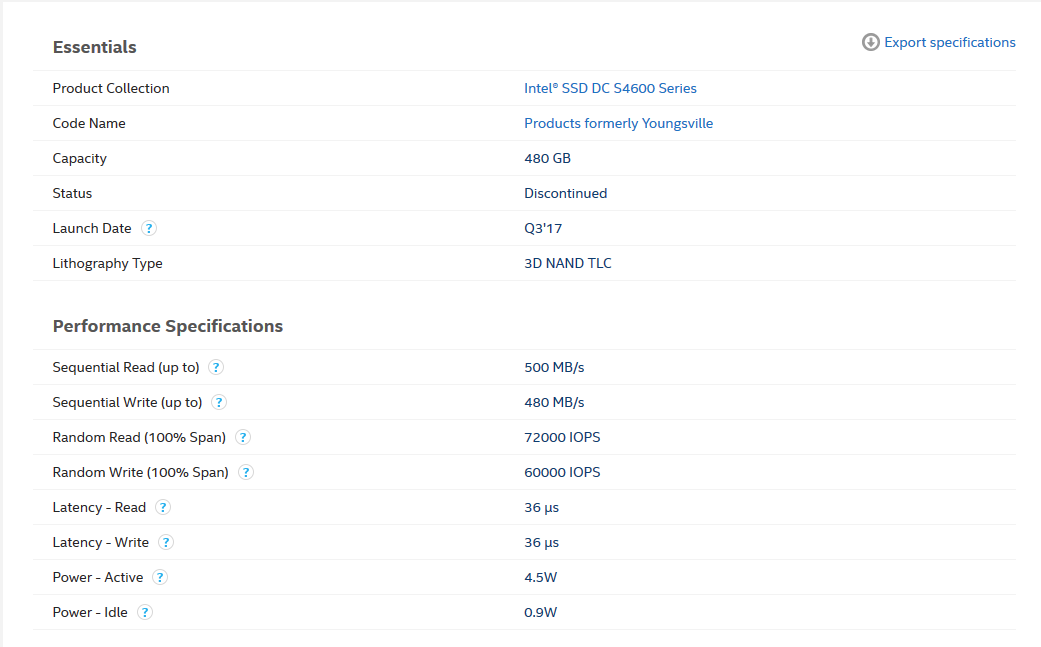
| Storage | 6 (SSD) – Intel® SSD DC S4600 Series 480GB
1 (NVMe) – Intel® Optane™ SSD DC P4800X Series 375GB |
Software:
| VMware ESXi | 7.0.0, 16324942 |
|---|---|
| HCIBench | 2.4.0 |
| Ceph | 14.2.11 |
| VMs – osd,mon,cli | CentOS 8.2 |
| FIO | 3.7 |
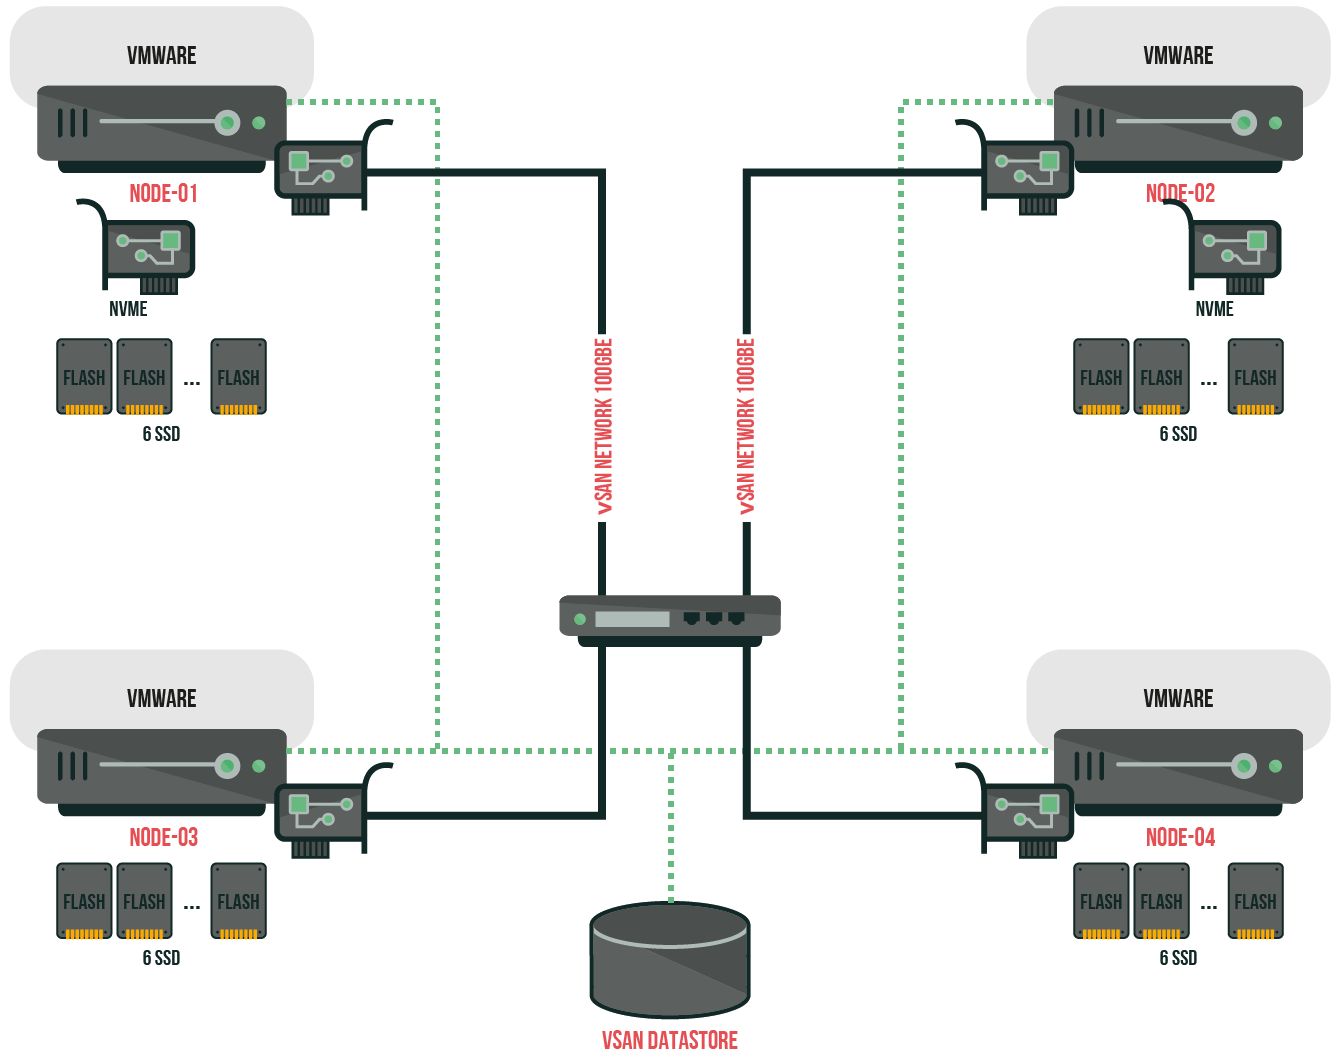
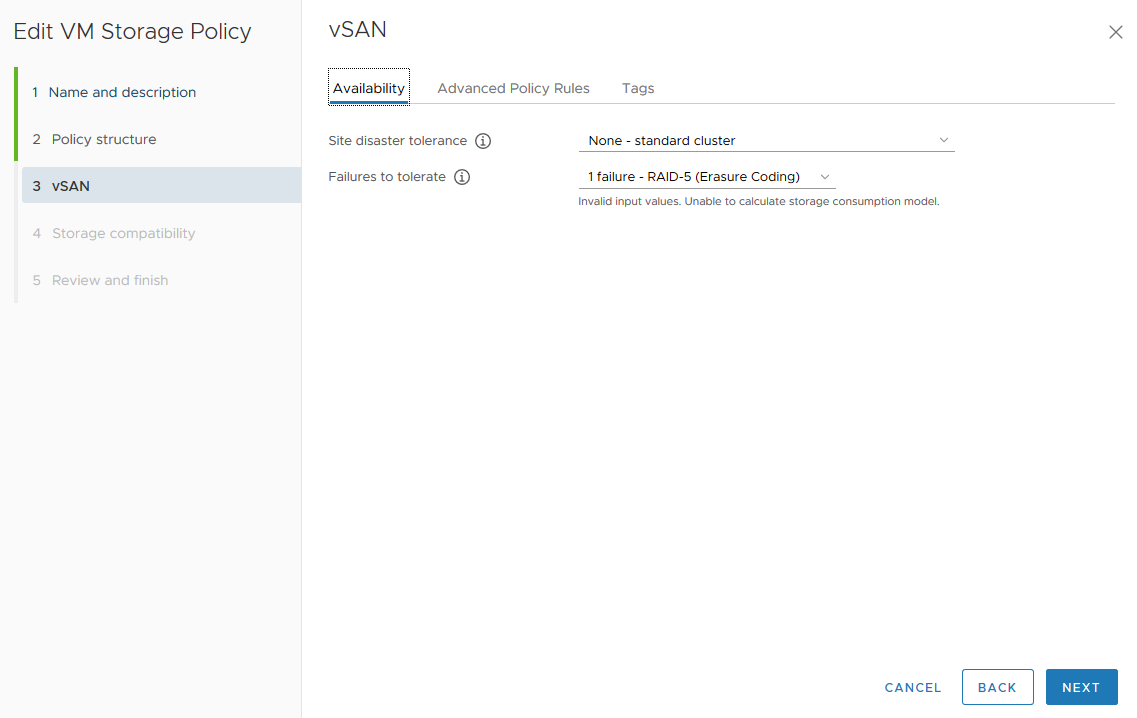
VMware vSAN:
Attention:
To create a vSAN datastore on each node, you’ll need a disk for caching for each node. The vSAN Storage Policy allows you to stripe an object across disks, so we will require testing parameter “Number of disk stripes per object = 1, 3, 6” as well, to determine the optimal configuration. VMware vSAN stripes data as follows:
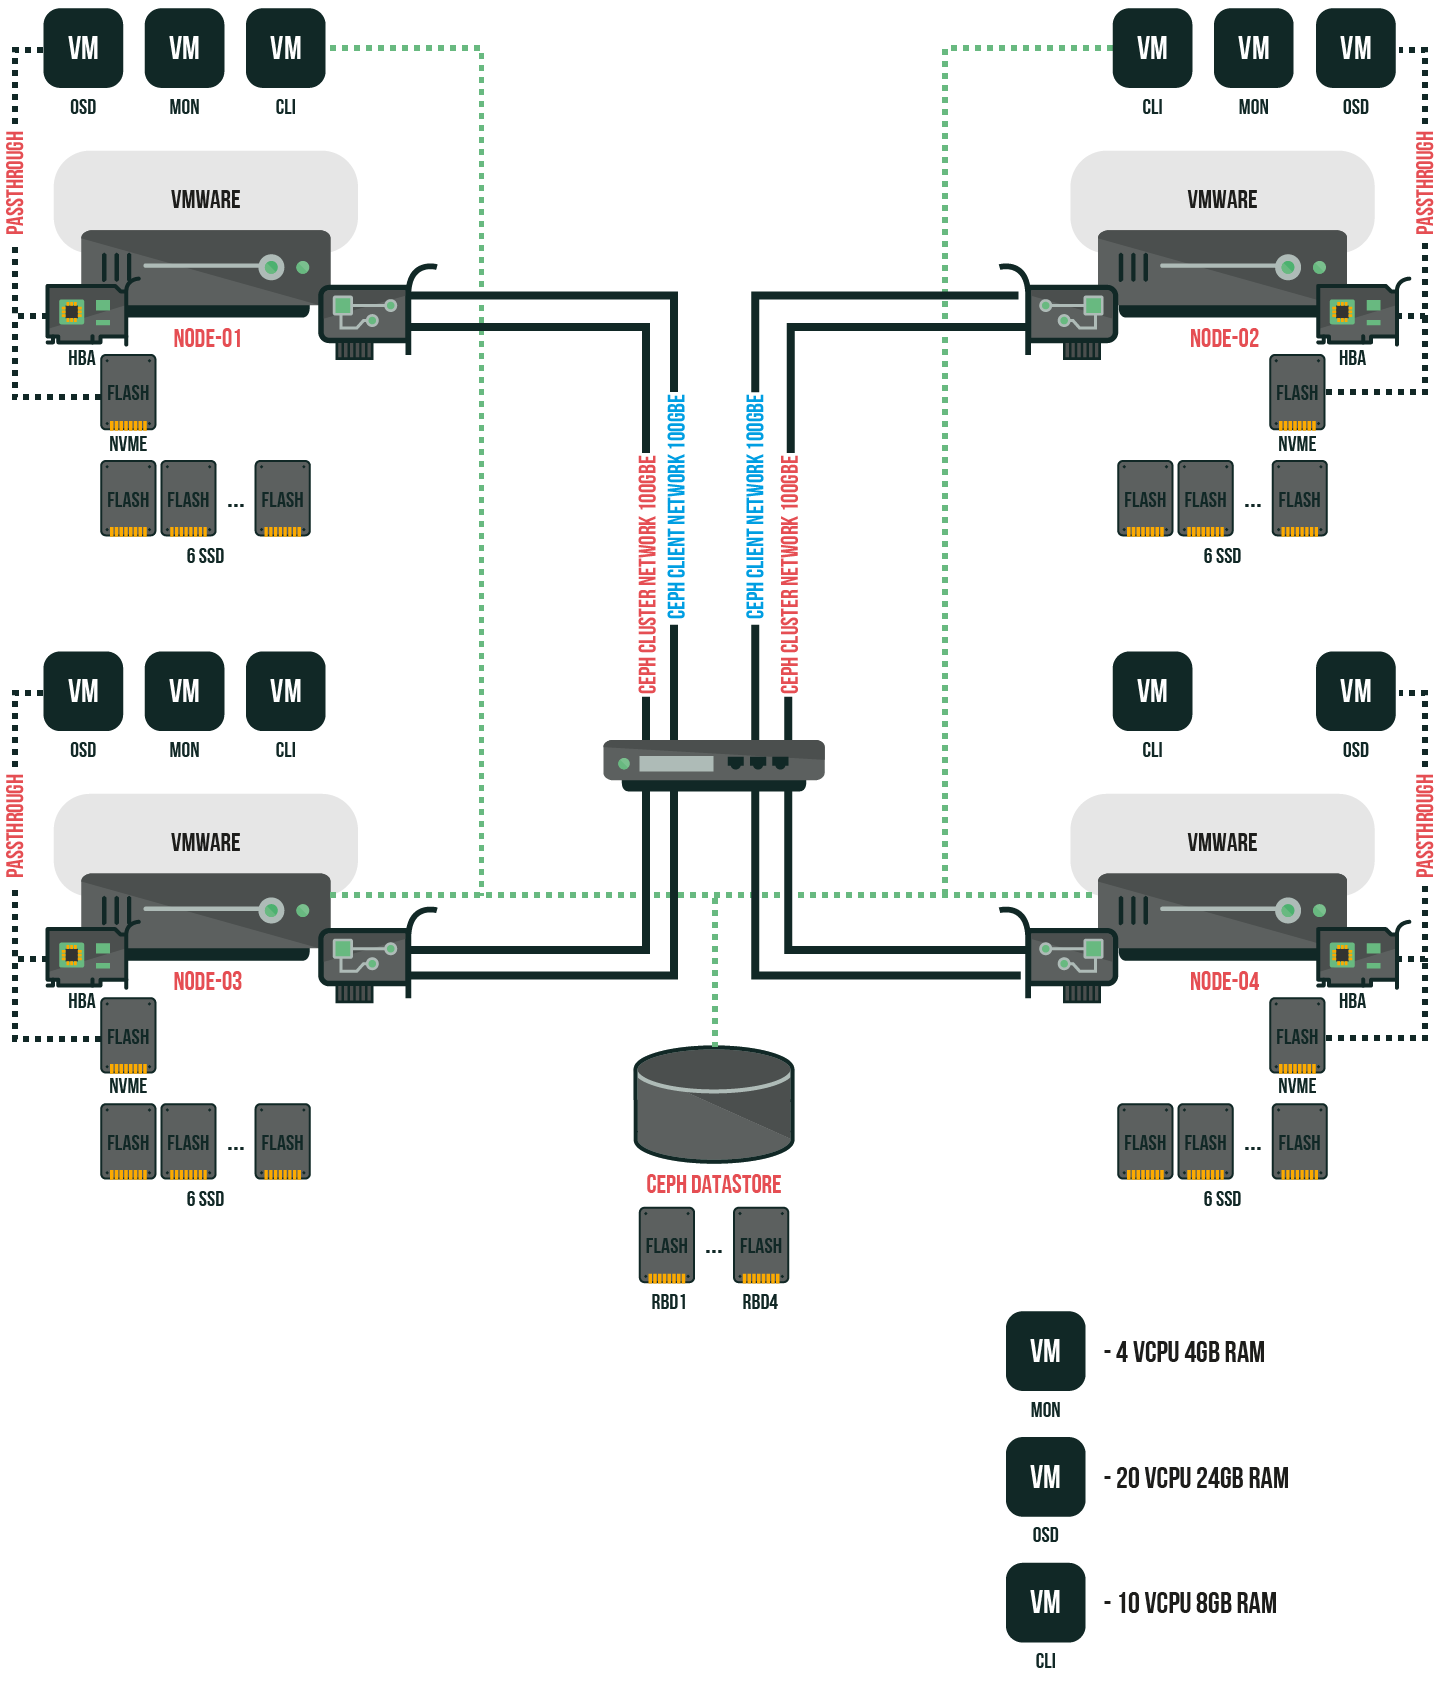
Ceph:
Attention:
Each client VM would address a separate 256GB RBD disk. The exclusive-lock & object-map parameters were disabled. On OSD VM NVMe, Intel® Optane™ SSD DC P4800X has been partitioned to 6 50GB logical volumes with bluestore db and wal for Ceph OSD each.
Erasure Coding Pool Parameters:
|
1 2 3 |
ceph osd erasure-code-profile set ISA-k3m1 plugin=isa technique=reed_sol_van k=3 m=1 crush-root=default crush-failure-domain=host ceph osd pool create ec 256 256 erasure ISA-k3m1 |
Ceph Cluster configuration file: ceph.conf.
Testing methods:
VMware vSAN
Testing will be performed with the following configuration: “HCIBench + fio”.
HCIBench will create test VMs with zeroed 100GB disk and launch fio with the following parameters:
Random Read 4k:
|
1 |
fio --name=job-name --rw=randread --numjobs=4 --iodepth=8 --blocksize=4K --direct=1 --ioengine=libaio --time_based=1 --group_reporting --lat_percentiles=1 --continue_on_error=all --filename=/dev/sda |
Random Write 4k:
|
1 |
fio --name=job-name --rw=randwrite --numjobs=4 --iodepth=8 --blocksize=4K --direct=1 --ioengine=libaio --time_based=1 --group_reporting --lat_percentiles=1 --continue_on_error=all --filename=/dev/sda |
Random Read 64k:
|
1 |
fio --name=job-name --rw=randread --numjobs=4 --iodepth=2 --blocksize=64K --direct=1 --ioengine=libaio --time_based=1 --group_reporting --lat_percentiles=1 --continue_on_error=all --filename=/dev/sda |
Random Write 64k:
|
1 |
fio --name=job-name --rw=randwrite --numjobs=4 --iodepth=2 --blocksize=64K --direct=1 --ioengine=libaio --time_based=1 --group_reporting --lat_percentiles=1 --continue_on_error=all --filename=/dev/sda |
The amount of VMs will be increased by 4 each time to establish the highest performance possible.
As usual, HCIBench will keep on clearing the cache after each testing (Clear Read/Write Cache Before Each Testing is the option designed for vSAN users to flush the cache tier before each test case).
As you already know, testing time will differ because VMware vSAN has caching. So, it’ll take some time until it’s clear and ready to go (in the case with All-flash – only write operations).
Ceph
Testing will be performed with the following configuration: “CLI VM + fio”.
Random Read 4k:
|
1 |
fio --rw=randrw --rwmixread=100 --numjobs=8 --ioengine=rbd --iodepth=16 --runtime=120 --direct=1 --bs=4K --time_based=1 --refill_buffers --group_reporting=1 --clientname=admin --pool=rbd --name=rbd --rbdname=rbdN |
Random Write 4k:
|
1 |
fio --rw=randrw --rwmixread=0 --numjobs=8 --ioengine=rbd --iodepth=8 --runtime=120 --direct=1 --bs=4K --time_based=1 --refill_buffers --group_reporting=1 --clientname=admin --pool=rbd --name=rbd --rbdname=rbdN |
Random Read 64k:
|
1 |
fio --rw=randrw --rwmixread=100 --numjobs=8 --ioengine=rbd --iodepth=16 --runtime=120 --direct=1 --bs=64K --time_based=1 --refill_buffers --group_reporting=1 --clientname=admin --pool=rbd --name=rbd --rbdname=rbdN |
Random Write 64k:
|
1 |
fio --rw=randrw --rwmixread=0 --numjobs=8 --ioengine=rbd --iodepth=8 --runtime=120 --direct=1 --bs=64K --time_based=1 --refill_buffers --group_reporting=1 --clientname=admin --pool=rbd --name=rbd --rbdname=rbdN |
Results were as follows:
Test time:
vSAN – 3600 sec;
Ceph – 600 sec;
NVMe and SSD performance testing:
As declared by the manufacturer:
VMware vSAN 16VM with “Number of disk stripes per object = 1,3 and 6” (the amount of disks in each node) parameters performance testing results:
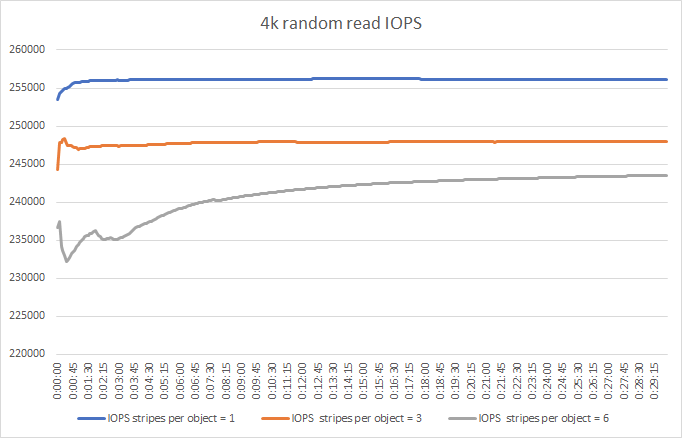
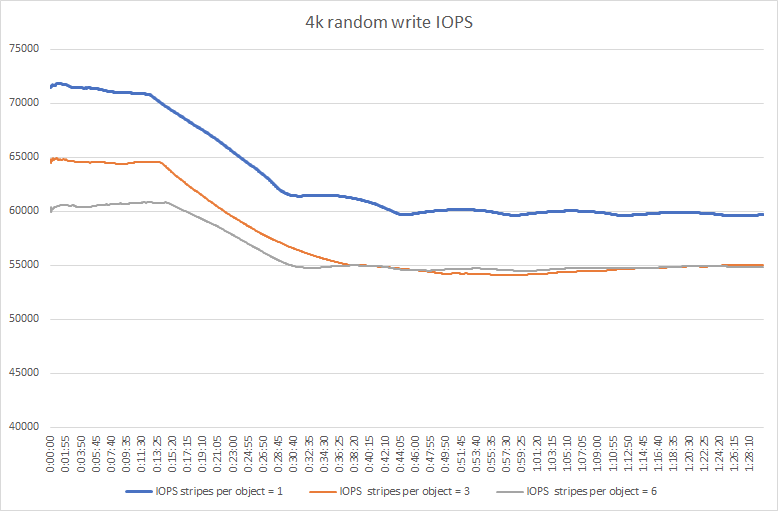
According to our test results, “Number of disk stripes per object = 1” is the optimal parameter for this configuration in terms of performance.
VMware vSAN testing results (I only count final results, since vSAN, as you remember, uses caching):
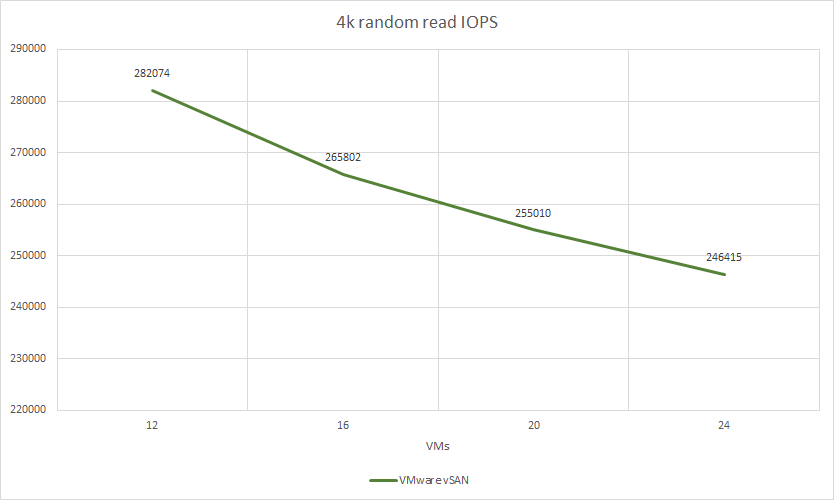
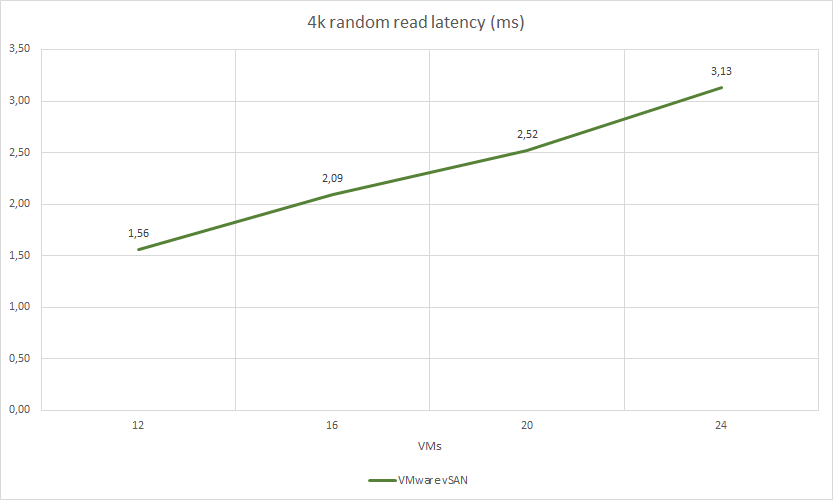
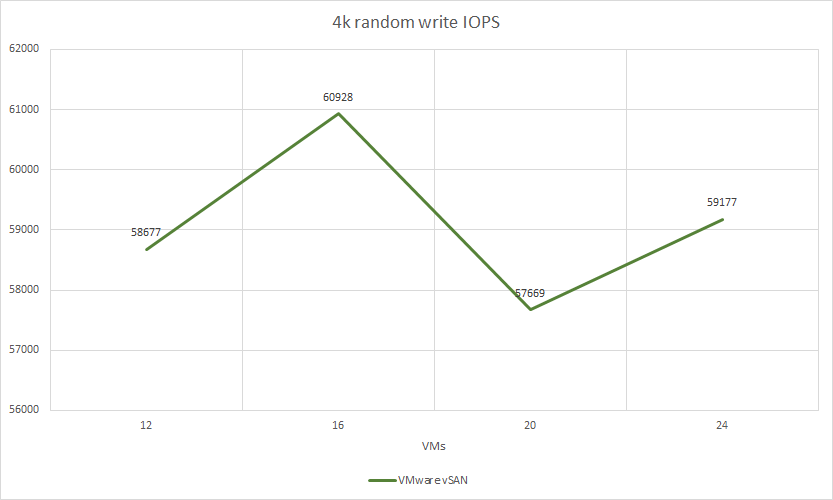
VMware vSAN test results:
| VMs count | pattern | jobs | iodepth | IOPS | MB/s | latency (ms) | CPU USAGE | RAM USAGE | vSAN PCPU USAGE |
|---|---|---|---|---|---|---|---|---|---|
| 12 | 4k random read | 4 | 8 | 282074 | 1101 | 1,56 | 49.81% | 44.0% | 18.1% |
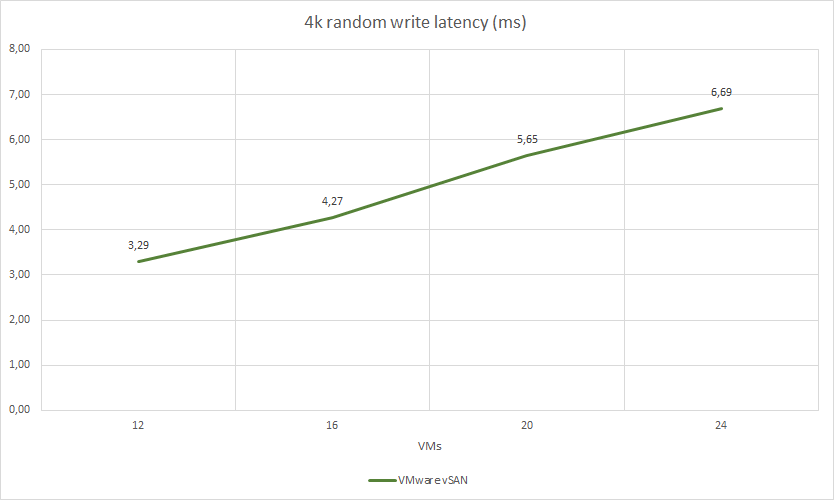
| 4k random write | 4 | 4 | 58677 | 229 | 3,29 | 41.95% | 44.0% | 13.32% | |
| 4k random read/write (70%/30%) | 4 | 4 | 130488 | 509 | 1,76 | 47.11% | 44.0% | 15.46% | |
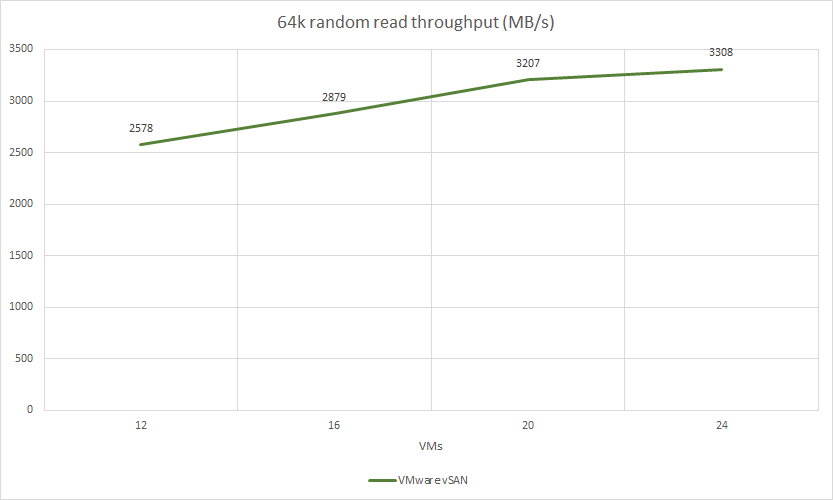
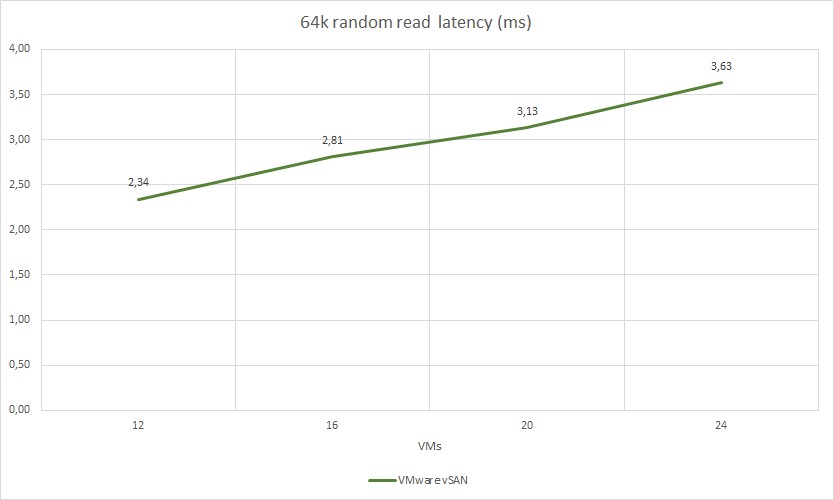
| 64k random read | 4 | 2 | 41252 | 2578 | 2,34 | 19.09% | 44.0% | 5.49% | |
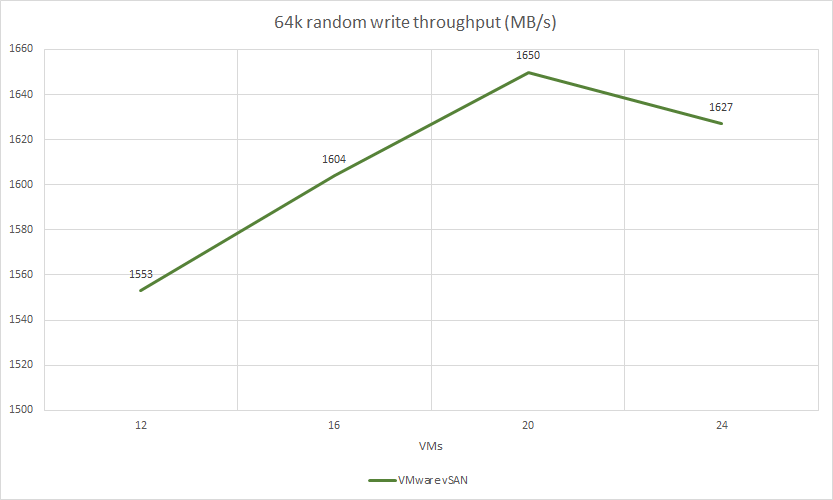
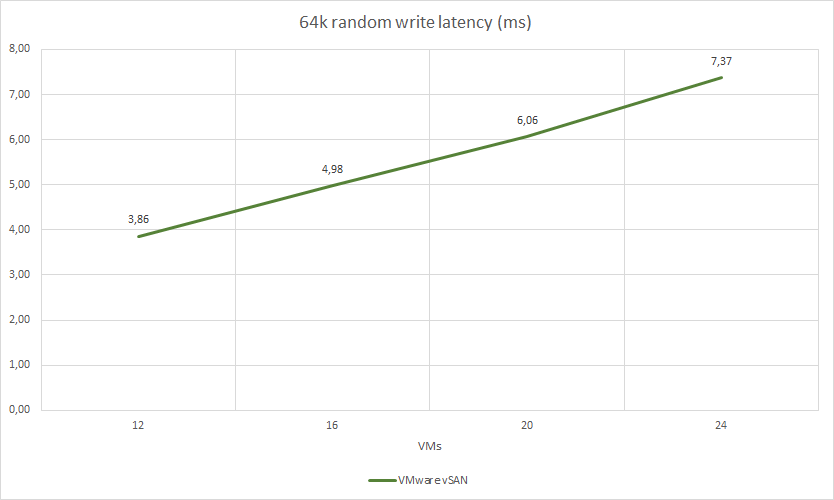
| 64k random write | 4 | 2 | 24856 | 1553 | 3,86 | 37.55% | 44.0% | 12.32% |
| VMs count | pattern | jobs | iodepth | IOPS | MB/s | latency (ms) | CPU USAGE | RAM USAGE | vSAN PCPU USAGE |
|---|---|---|---|---|---|---|---|---|---|
| 16 | 4k random read | 4 | 8 | 265802 | 1038 | 2,09 | 49.58% | 45.0% | 17.2% |
| 4k random write | 4 | 4 | 60928 | 237 | 4,27 | 44.24% | 45.0% | 14.22% | |
| 4k random read/write (70%/30%) | 4 | 4 | 133302 | 520 | 2,33 | 49.41% | 45.0% | 16.24% | |
| 64k random read | 4 | 2 | 46071 | 2879 | 2,81 | 21.25% | 45.0% | 6.15% | |
| 64k random write | 4 | 2 | 25679 | 1604 | 4,98 | 39.62% | 45.0% | 13.4% |
| VMs count | pattern | jobs | iodepth | IOPS | MB/s | latency (ms) | CPU USAGE | RAM USAGE | vSAN PCPU USAGE |
|---|---|---|---|---|---|---|---|---|---|
| 20 | 4k random read | 4 | 8 | 255010 | 996 | 2,52 | 51.22% | 47.0% | 17.86% |
| 4k random write | 4 | 4 | 57669 | 225 | 5,65 | 43.7% | 46.75% | 14.07% | |
| 4k random read/write (70%/30%) | 4 | 4 | 133414 | 521 | 2,96 | 50.78% | 46.75% | 16.42% | |
| 64k random read | 4 | 2 | 51322 | 3207 | 3,13 | 23.96% | 46.75% | 7.16% | |
| 64k random write | 4 | 2 | 26400 | 1605 | 6,06 | 41.41% | 46.75% | 13.74% |
| VMs count | pattern | jobs | iodepth | IOPS | MB/s | latency (ms) | CPU USAGE | RAM USAGE | vSAN PCPU USAGE |
|---|---|---|---|---|---|---|---|---|---|
| 24 | 4k random read | 4 | 8 | 246415 | 962 | 3,13 | 51.32% | 48.44% | 17.8% |
| 4k random write | 4 | 4 | 59177 | 231 | 6,69 | 45.9% | 47.79% | 14.56% | |
| 4k random read/write (70%/30%) | 4 | 4 | 120857 | 472 | 3,80 | 48.93% | 48.0% | 16.08% | |
| 64k random read | 4 | 2 | 52944 | 3308 | 3,63 | 25.0% | 48.0% | 7.48% | |
| 64k random write | 4 | 2 | 26034 | 1627 | 7,37 | 41.72% | 48.0% | 13.72% |
Ceph testing results:
<thCPU OSD USAGECPU CLIENT USAGE
| pattern | jobs | iodepth | IOPS | MB/s | latency (ms) | ||
|---|---|---|---|---|---|---|---|
| 4k random read | 8 | 16 | 56500 | 220,6 | 9,00 | 75,00% | 32,00% |
| 4k random write | 8 | 8 | 14961 | 58,4 | 17,08 | 80,00% | 11,00% |
| 64k random read | 8 | 16 | 39099 | 2444 | 13,07 | 72,00% | 28,00% |
| 64k random write | 8 | 8 | 13358 | 836 | 19,12 | 78,00% | 13,00% |
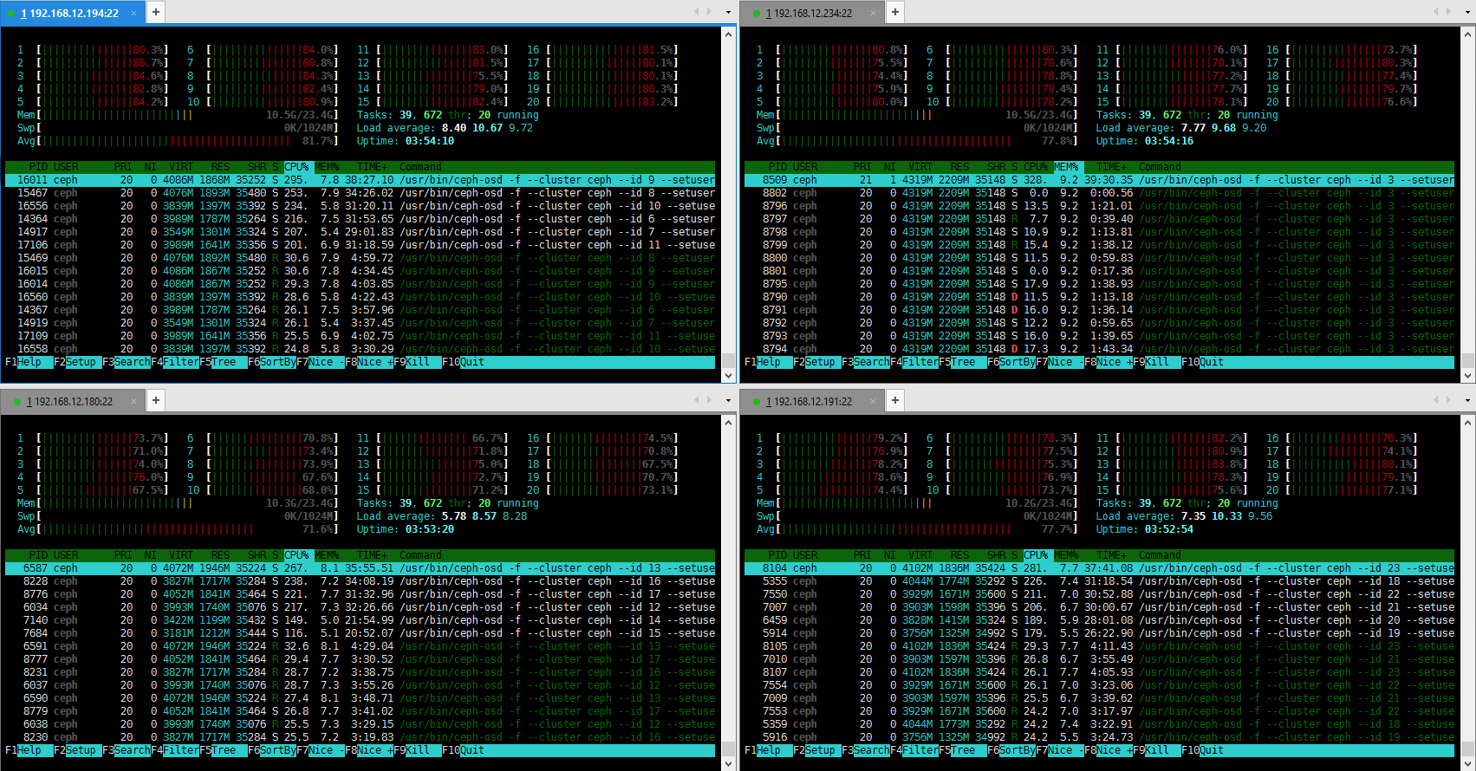
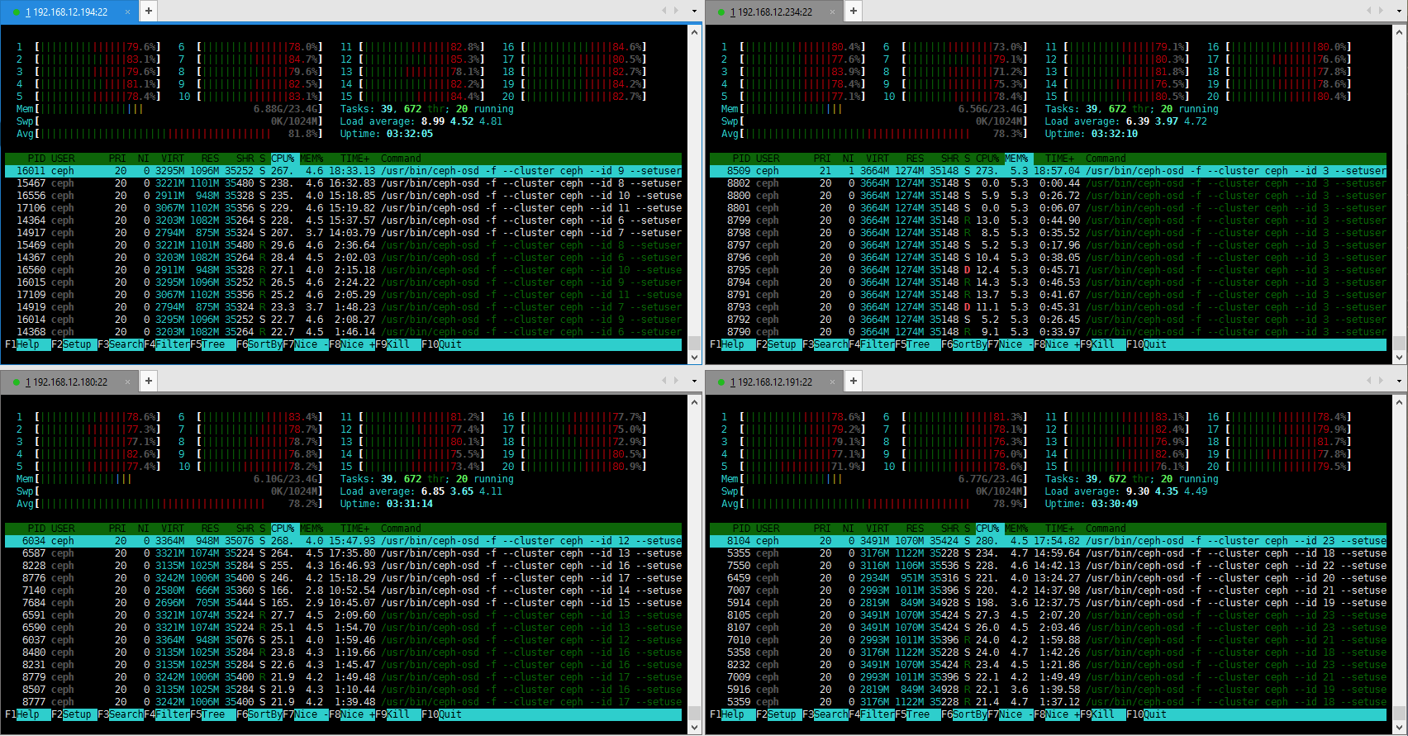
It becomes apparent that Ceph erasure coding operations require a lot of CPU resources, so that’s pretty much the only thing that counts on OSD VMs.
OSD VMs CPU (random read 4k):
OSD VMs CPU (random write 4k):
VMware vSAN vs Ceph:
| VMware vSAN (16 VMs) | Ceph | Comparison | |||||||
|---|---|---|---|---|---|---|---|---|---|
| pattern | IOPS | MB/s | latency (ms) | IOPS | MB/s | latency (ms) | IOPS | MB/s | latency (ms) |
| 4k random read | 265802,25 | 1038 | 2,09 | 56500 | 220,6 | 9,00 | 20,03% | 20,04% | 576,92% |
| 4k random write | 60927,55 | 237 | 4,27 | 14961 | 58,4 | 17,08 | 24,56% | 24,64% | 400,00% |
| 64k random read | 46070,91 | 2879 | 2,81 | 39099 | 2444 | 13,07 | 73,85% | 73,88% | 360,06% |
| 64k random write | 25678,6 | 1604 | 4,98 | 13358 | 836 | 19,12 | 50,60% | 50,67% | 315,43% |
Conclusions
Well, the results are definitive, but the conclusions are not as simple. VMware vSAN showed impressive performance of erasure coding operations, and even though Ceph manufacturers do give some explanation in that regard (look for “How fast is it?”), it still is slower.
However, since the speed is practically the only issue, whether to use Ceph or not is up to you. You got results and everything you need, and I only hope that my work was of any use.